Life Span
The above graphs display real-time statistics for a set time period. A sliding window of data is displayed once the specified time has passed. This means that old data will be removed from the graph to make room for new data. Set the length of time for this sliding window via the Time span of graphs option.
Filters
Use the Filtering Options option to apply one of the following filters:
| Filter | Description |
|---|---|
|
CNAME |
Filters all graphs for requests that point to the selected edge CNAME. Real-time statistics will only be provided when custom reports has been enabled on the selected edge CNAME. |
|
POP |
Filters all graphs for requests that were processed by the selected POP. |
|
Country |
Filters all graphs for requests that were processed by a POP in the selected country. |
Only a single filter may be applied to these graphs at any given time.
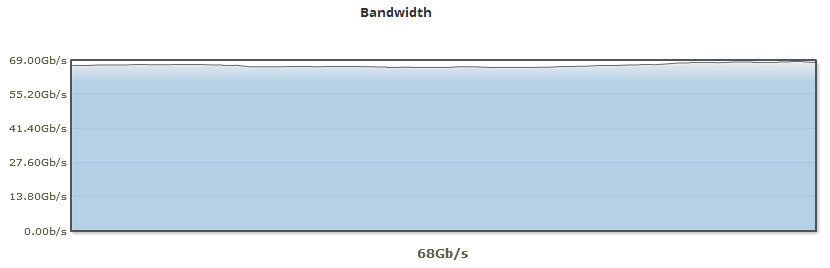
Bandwidth
The Bandwidth graph displays bandwidth usage
The units used by to report bandwidth usage are one of the following: bits per second (b/s), Kilobits per second (Kb/s), Megabits per second (Mb/s), or Gigabits per second (Gb/s).
Status Codes
The Status Codes graph consists of color-coded lines that indicate how often HTTP response codes are occurring over a specified period of time. The left side of the graph (y-axis) indicates how often a status code is returned for requests, while the bottom of the graph (x-axis) indicates the progression of time.
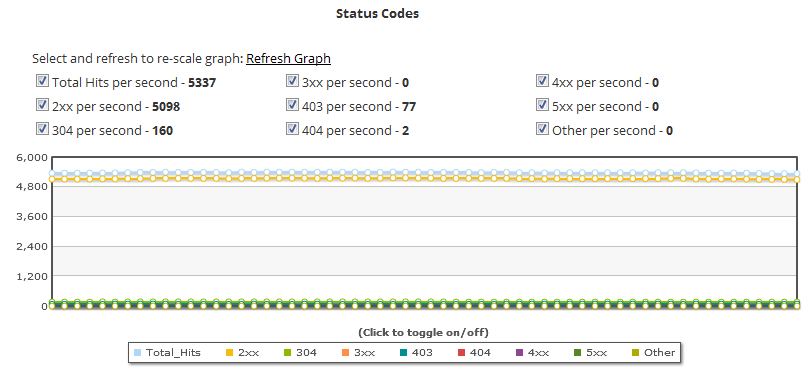
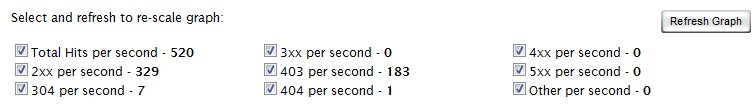
A list of status codes is displayed directly above the graph. This list indicates each status code that can be included in the line graph and the current number of occurrences per second for that status code. By default, a line is displayed for each of these status codes in the graph. However, you can choose to only monitor the status codes that have special significance for your CDN configuration. This can be accomplished by only marking the desired status code options and clearing all other options. After you are satisfied with the status codes that will be displayed in the graph, you should click Refresh Graph. This will prevent the cleared status codes from being included in the graph.
The Refresh Graph option will clear the graph. After which, it will only display the selected status codes.
Each status code option is described below.
| Name | Description |
|---|---|
|
Total Hits per second |
Determines whether the total number of requests per second |
|
2xx per second |
Determines whether the total number of 2xx status codes (e.g., 200, 201, 202, etc.) that occur per second |
|
304 per second |
Determines whether the total number of 304 status codes that occur per second |
|
3xx per second |
Determines whether the total number of 3xx status codes (e.g., 300, 301, 302, etc.) that occur per second |
|
403 per second |
Determines whether the total number of 403 status codes that occur per second |
|
404 per second |
Determines whether the total number of 404 status codes that occur per second |
|
4xx per second |
Determines whether the total number of 4xx status codes (e.g., 400, 401, 402, 405, etc.) that occur per second |
|
5xx per second |
Determines whether the total number of 5xx status codes (e.g., 500, 501, 502, etc.) that occur per second |
|
Other per second |
Determines whether the total occurrences for all other status codes will be reported in the graph. |
Learn more about common status codes.
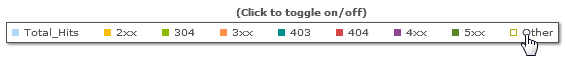
Logged data for a particular status code may be temporarily hidden by clearing the corresponding option from the area directly below the graph. The selected status code will be immediately hidden from the graph. Marking that status code option will cause that option to be displayed again.
The color-coded options directly below the graph only affect what is displayed in the graph. It does not affect whether the graph will keep track of that status code.
Cache Statuses
The Cache Statuses graph consists of color-coded lines that indicate how often certain types of cache statuses are occurring over a specified period of time. The left side of the graph (y-axis) indicates how often a cache status is returned for requests, while the bottom of the graph (x-axis) indicates the progression of time.
Learn more about cache status codes.

A list of cache statuses is displayed directly above the graph. This list indicates each cache status that can be included in the line graph and the current number of occurrences per second for that cache status. By default, a line is displayed for each of these cache statuses in the graph. However, you can choose to only monitor the cache statuses that have special significance for your CDN configuration. This can be accomplished by only marking the desired cache status options and clearing all other options. After you are satisfied with the cache statuses that will be displayed in the graph, you should click Refresh Graph. This will prevent the cleared status codes from being included in the graph.
The Refresh Graph option will clear the graph. After which, it will only display the selected cache statuses.

Logged data for a particular response code may be temporarily hidden by clearing the corresponding option from the area directly below the graph. The selected response code will be immediately hidden from the graph. Marking that response code option will cause that option to be displayed again.
The color-coded options directly below the graph only affect what is displayed in the graph. It does not affect whether the graph will keep track of that status code.

Connections
This line graph reports the average number of new connections per second
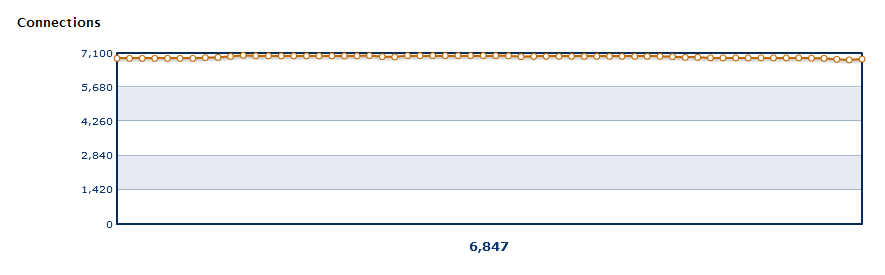
Key information:
- By default, this line graph contains approximately 5 minutes worth of data. Customize this window through the Time span of graphs option at the top of the page.
- Data on the number of new connections is plotted at regular intervals (e.g., five seconds when the graph's time span is 5 minutes). Data older than the time span defined in the Time span of graphs option will be removed from the graph to make room for newer data.
-
A user agent's (e.g., web browser) initial request for content will always establish a connection. After which, the user agent determines whether future requests within that session will reuse that connection or whether new connections will be established.
-
This statistic is calculated using the following two steps:
- Each edge server calculates the number of new connections per second over the course of a minute.
- This data is collected from all edge servers and then averaged.
Edgecast CDN