This type of report tracks bandwidth (Mbps) usage by
A Bandwidth report consists of a graph indicating the bandwidth usage for the selected
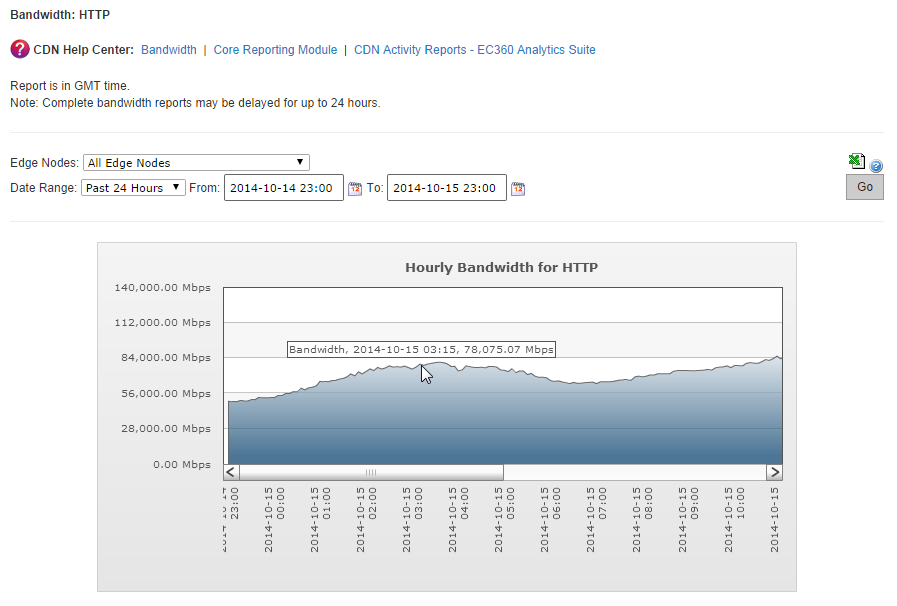
Key information:
- View the amount of bandwidth usage at any given time by hovering over the desired point in the line (as illustrated above). The time interval between points in the line is determined by whether you are viewing an hourly (5 minute increments) or daily (hourly increments) report.
- Data is reported in 5 minute chunks.
- If you are viewing data for a recent time period (e.g., Today or Past 24 Hours), then you will notice that amount of bandwidth usage tapers off as it approaches the current time. This trend is a result of the amount of time that it takes for log information to be collected from our edge servers.
The data that was used to generate the graph can be viewed below it. A table indicates bandwidth usage (megabits per second) in five minute intervals over the time period covered by the report.
Graph information:
- Title: Indicates whether time will be expressed by hour or by day.
- Y-axis (Left): Indicates bandwidth usage in megabits per second (Mbps).
-
X-axis (Below): Indicates the time for the bandwidth reported by the corresponding data point in the graph. The time interval between data points can be either hourly or daily.
-
Hourly: This time interval is used for the "Past 24 Hours," "Today," and "Yesterday" time periods.
-
Daily: This time interval is used for all other time periods.
-
To generate a Bandwidth report
-
Load the Bandwidth report.
- From the main menu, navigate to Analytics | Core Reports.
- From the side navigation bar, expand Bandwidth and then select the desired platform and protocol combination (e.g., HTTPS Large).
A graph will display bandwidth usage statistics for that platform/protocol combination over the last 24 hours for all POPs.
-
Optional. Use the Date Range option to define either a custom or predefined (e.g., This Week) time period for which report data will be generated.
Edgecast CDN