The purpose of the Cache Hit Ratio report is to indicate the percentage of cacheable requests that were served directly from cache to the requester. In other words, the percentage of requests that met the following requirements:
- The requested content was cached on the POP closest to the requester.
- The request was served directly from the edge of our network.
- The request did not require revalidation with the origin server.
This report excludes all of the following cases:
- Requests that are denied due to Rules Engine.
- Requests that are denied due to Token-Based Authentication.
- Requests that are denied due to country filtering options.
- Requests that contain query string URLs when the query-string caching feature has been set to "no-cache."
-
Requests for assets whose headers indicate that they should not be cached. For example, Cache-Control: private, Cache-Control: no-cache, or Pragma: no-cache headers will prevent an asset from being cached.
An exception to the above scenario may occur when Rules Engine overrides the requested content’s cache policy.
- Requests for partially cached content.
This report consists of a graph and statistical information on cache hits.
It is calculated through the following formula:
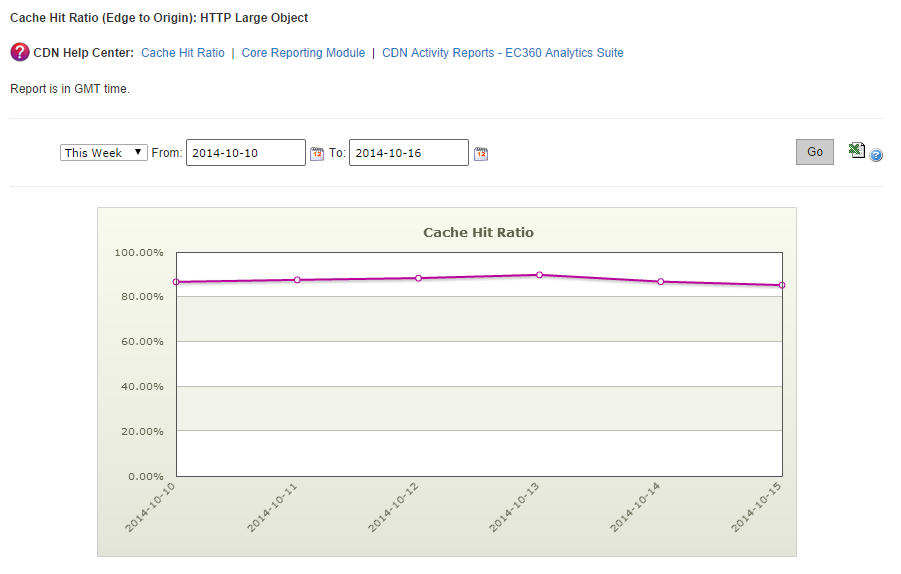
View the exact cache hit ratio on a given date by hovering over the hollow circles in the line graph.
The data that was used to generate the graph can be viewed directly below it. The date, total number of hits, total number of misses, and the cache hit percentage will be displayed for each plotted point in the graph.
Graph information:
- Y-axis (Left): Measures cache hits as a percentage of overall requests.
-
X-axis (Below): Indicates the time for the cache hit ratio reported by the corresponding data point in the graph. The time interval between data points is always daily.
To generate a Cache Hit Ratio report
-
Load the Cache Hit Ratio report.
- From the main menu, navigate to Analytics | Core Reports.
- From the side navigation bar, expand Cache Hit Ratio and then select the desired platform and protocol combination (e.g., HTTPS Large).
A graph will display the percentage of hits that result in an asset being served from cache for the selected platform(s) over the last week for all POPs.
-
Optional. Use the Date Range option to define either a custom or predefined (e.g., This Week) time period for which report data will be generated.
Edgecast CDN