The Cache Statuses report gives a detailed breakdown of cache behavior, which may reveal approaches for improving the overall end-user experience. Since the fastest performance comes from cache hits, you can optimize data delivery speeds by minimizing cache misses and expired cache hits. Cache misses can be reduced by configuring your origin server to avoid assigning "no-cache" response headers, by avoiding query-string caching except where strictly needed, and by avoiding uncacheable response codes. Expired cache hits can be avoided by making an asset's max-age as long as possible to minimize the number of requests to the origin server.
Learn more about cache status codes.
The data that was used to generate the pie chart can be viewed directly below it. Each cache status is listed along with a description, the total number of times that it occurred, and the percentage of requests that resulted in this cache status.
To generate a Cache Statuses report
-
Load the Cache Statuses report.
- From the main menu, navigate to Analytics | Core Reports.
- From the side navigation bar, expand Cache Statuses and then select the desired platform and protocol combination (e.g., HTTPS Large).
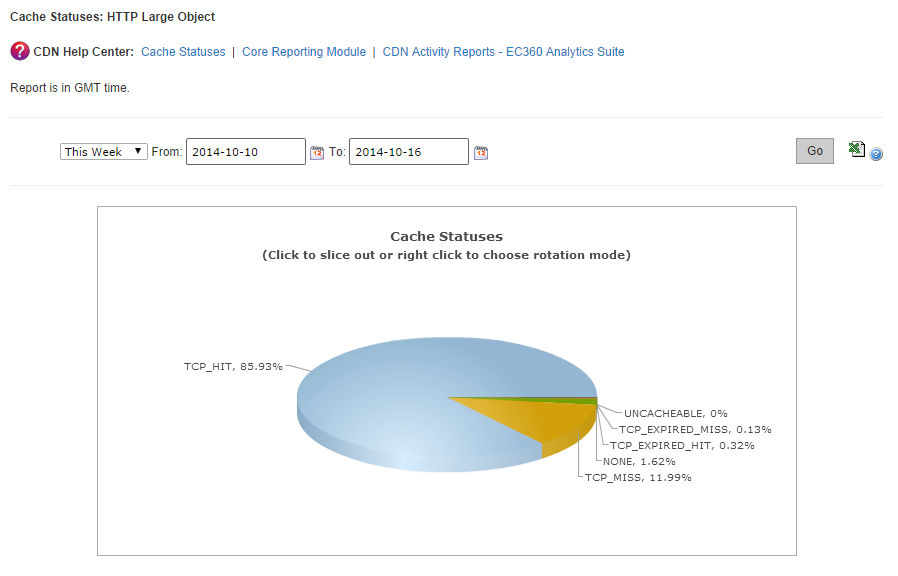
A graph will display cache status statistics for the selected platform(s) over the last week for all POPs.
-
Optional. Use the Date Range option to define either a custom or predefined (e.g., This Week) time period for which report data will be generated.
Edgecast CDN