This type of report provides hits and data transferred statistics for edge CNAMEs on which custom report logging has been enabled.
Custom report logging may be enabled on the desired edge CNAME from the Edge CNAMEs page.
Key information about activating custom reports on a per edge CNAME basis:
-
Custom report data logging starts approximately one hour after enabling an edge CNAME's custom reporting capability.
-
Report Details
Generate a custom report by defining the following report options:
| Report Option | Description |
|---|---|
|
Platform |
Choose whether a custom report will be generated for all platforms or a specific one. By default, the Custom Reports page generates a report for all platforms. Generate a platform-specific report by selecting the desired platform from the side navigation bar. |
|
Generate a custom report for either of the following metrics by setting the Metrics option:
|
|
|
The type of statistics that will be shown below the bar chart is determined by the Groupings option. Set this option to either of the following values:
|
|
|
Time Period |
The time period for which a custom report will be generated may be defined. |
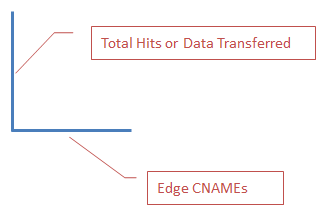
After generating a custom report, a bar chart will be generated for the top 10 edge CNAMEs according to the metric defined in the Metrics option.
The following variables may affect this calculation:
- A custom report will only include edge CNAMEs for which this capability has been activated.
- Was the custom report capability was turned on for a particular edge CNAME during or after the time period specified for the custom report? If so, then the edge CNAME may either be ranked lower than it should or it may not even be included in the custom report.
This bar chart allows a quick assessment of the edge CNAMEs producing the most amount of traffic.
View the amount of data transferred on a specific edge CNAME over the specified time frame by hovering over the desired bar.
Directly below the bar chart, statistics on hits or the amount of data transferred on a per edge CNAME basis are broken down by either cache status code or HTTP status code.
The type of statistics that will be shown is determined by the Groupings option.
To generate an Edge CNAMEs report
-
Load the Custom Reports module.
- From the main menu, navigate to Analytics | Custom Reports.
- From the side navigation bar, expand Edge CNAMEs and then select the desired platform (e.g., HTTP Large).
A graph will be generated for traffic that meets the following requirements:
- The traffic was served over the selected platform (e.g., All Platforms or ADN).
- The traffic was served on an edge CNAME on which the custom reporting capability has been activated.
- Optional. Use the Metrics option to determine whether a report will be generated for hits or data transferred.
- Optional. Use the Groupings option to determine whether statistics will be broken down by the status code returned to the client or cache status code.
-
Optional. Use the Date Range option to define either a custom or predefined (e.g., This Week) time period for which report data will be generated.
More Information
Edgecast CDN