RTLD may automatically deliver compressed log data to Splunk Enterprise by submitting HTTPS POST requests to it. The Splunk HTTP Event Collector (HEC) will collect and log each request. Each request contains a compressed JSON document that describes one or more log entries.
Learn more: RTLD CDN | RTLD Rate Limiting
The format for log data delivered to Splunk Enterprise is JSON Lines. This log format does not provide information that uniquely identifies a set of log data. As a result, there is no way to check for gaps in sequence numbers when attempting to identify missing log data.
To create a log delivery profile
-
Set up Splunk Enterprise's HTTP Event Collector to accept CDN log data in JSON format.
-
Verify your Splunk Enterprise 7.x setup.
- Your instance of Splunk Enterprise 7.x must be secured with SSL.
- SSL must be enabled on the HTTP Event Collector.
For information on how to set up Splunk Enterprise, please refer to their documentation.
-
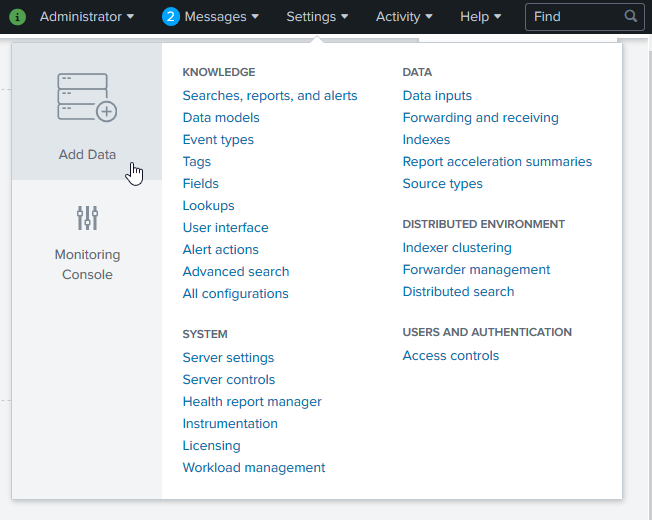
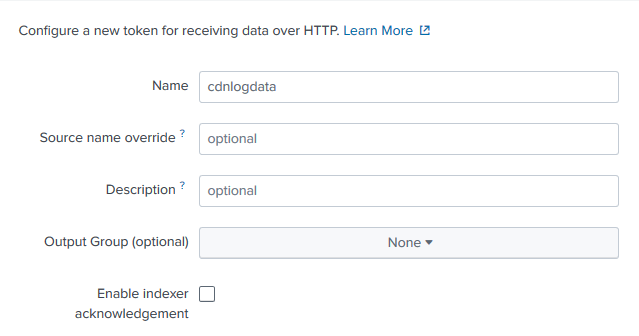
From with Splunk Enterprise, click Settings and then Add Data.

-
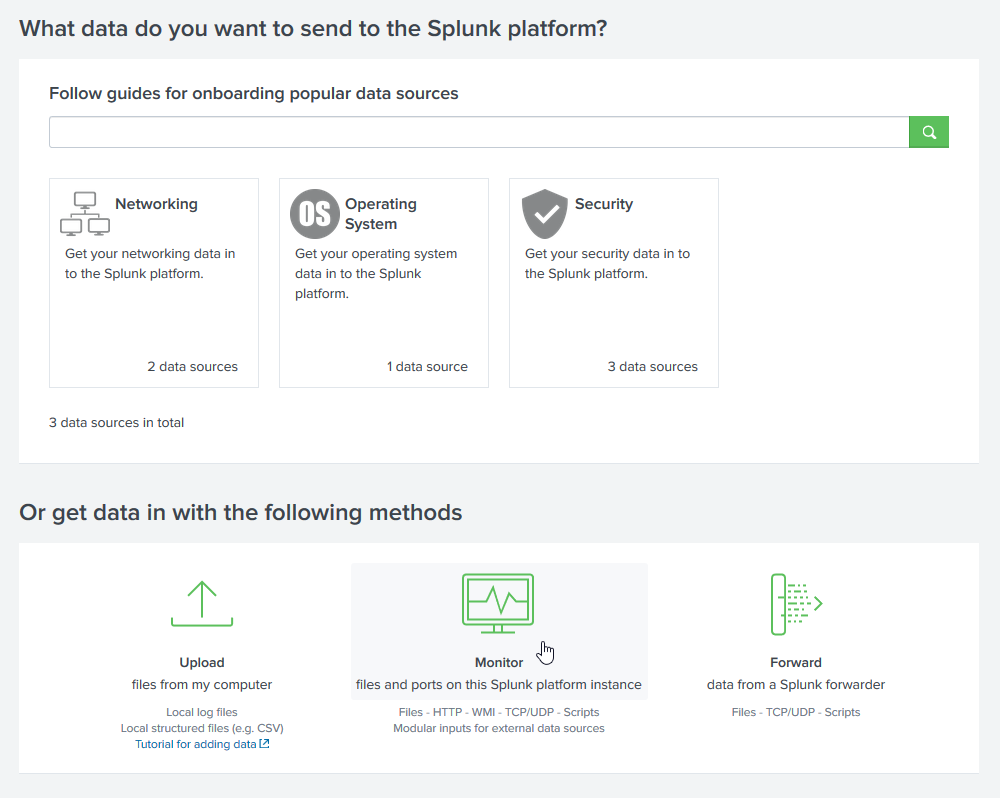
Click Monitor.

-
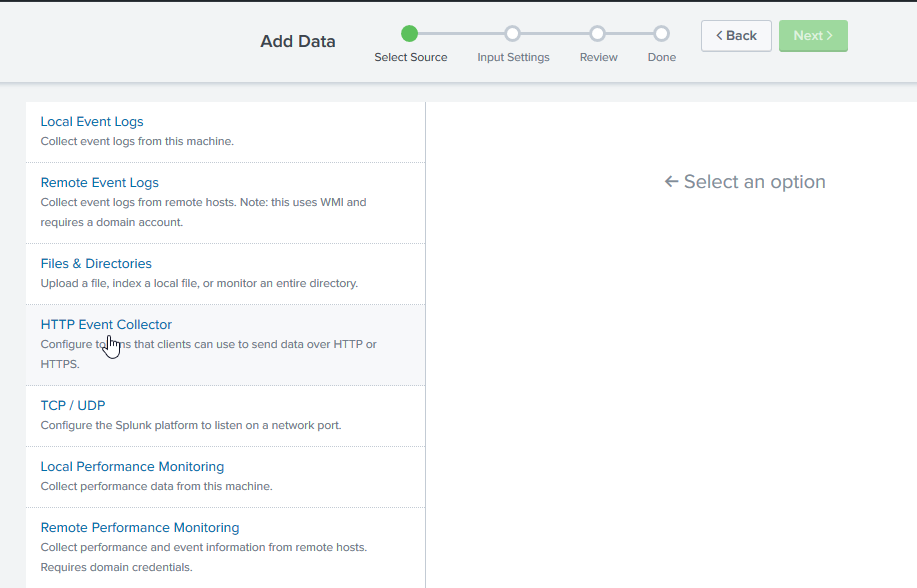
Click HTTP Event Collector.

-
In the Name option, define a name for the CDN log data that will be collected.

- Click Next >.
-
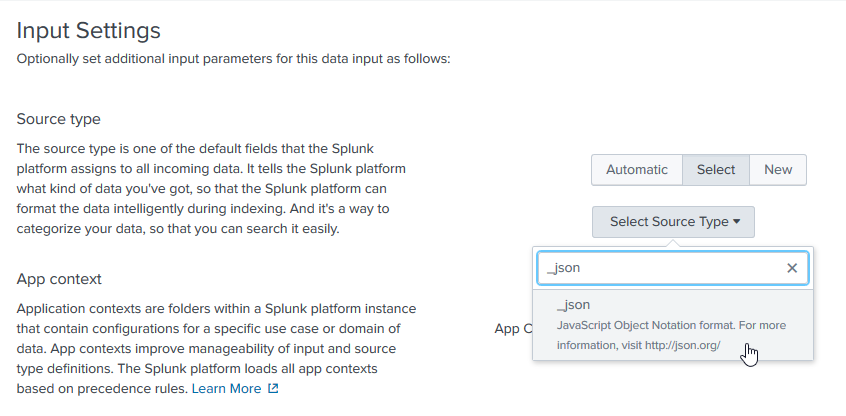
Click Select to display the Select Source Type option. Click that option, type "_json" to filter source types, and then select it.

- Click Review.
- Click Submit > to finish setting up the HTTP Event Collector. An HEC token will be generated. Use this token to authorize requests posted to the HEC.
-
-
Perform the following steps if you have hosted Splunk Enterprise within your network:
-
Configure your firewall to allow POST requests from the following IP blocks:
198.7.21.0/24
-
If you plan to deliver log data via a custom port, then you should also configure your firewall to allow requests on that port.
-
Set up support for the HTTPS protocol.
Log delivery requires a certificate whose trust anchor is a publicly trusted certificate authority (CA). Additionally, the certificate must include a chain of trust for all intermediate certificate(s) and a leaf certificate.
-
-
Navigate to the Real-Time Log Delivery CDN | Rate Limiting
- Click Add Profile.
- From the Log Delivery Method option, select Splunk Enterprise.
-
Set the Splunk URL option to a URL that points to your Splunk Enterprise's HTTP Event Collector configuration.
Default URL syntax:
https://Splunk-Enterprise-HostnameReplace this variable with the hostname where your instance of Splunk Enterprise is hosted.:portIdentifies the port number (e.g., 8088) that the HTTP Event Collector is listening for data. This port number may be configured when defining your HEC's global settings./services/collector/raw -
Set the HEC Token option to the token generated for the HTTP Event Collector configuration created in step 1.
-
From the Downsample the Logs option, determine whether all or downsampledReduces the amount of log data that will be delivered. For example, you may choose to only deliver 1% of your log data. log data will be delivered.
- All Log Data: Verify that the Downsample the Logs option is disabled.
-
Downsampled Log Data: Downsample logs to 0.1%, 1%, 25%, 50%, or 75% of total log data by enabling the Downsample the Logs option and then selecting the desired rate from the Downsampling Rate option.
Use this capability to reduce the amount of data that needs to be processed or stored by Splunk Enterprise.
RTLD CDN Only: Downsampling log data also reduces usage charges for this service.
-
Log delivery setup varies according to whether you are delivering log data for CDN traffic
 To set up RTLD CDN
- From the Log Delivery section, mark each delivery platform for which real-time log data may be delivered.
-
From the Filter by Edge CNAME section, perform one of the following steps:
-
Filter log data by one or more edge CNAME(s)
- Determine whether log data will be filtered to include or exclude requests to the selected edge CNAME(s) by selecting either Matches or Does Not Match, respectively.
-
Select one or more edge CNAMEs from the option directly to the right of the above option.
Filter the list by typing the entire or partial hostname. For example, typing co will filter the list to include all hostnames that contain co (e.g., cdn.example.com and corp.example.org).
-
Upload all log data regardless of edge CNAME
Verify that an edge CNAME has not been defined within this section.
-
-
From the Filter by User Agent option, perform one of the following steps:
-
Filter log data by user agent
Type a RE2-compatible regular expressionThis type of value is interpreted as a regular expression that defines a pattern of characters. pattern that identifies the set of user agents by which log data will be filtered.
-
Upload all log data regardless of user agent
Set it to a blank value.
-
-
From the Filter by Status Code section, perform one of the following steps:
-
Filter log data by status code
Mark each status code class (e.g., 2xx or 3xx) for which log data will be delivered. Clear all other status code classes.
-
Upload all log data regardless of status code
Clear all status code classes (e.g., 2xx and 3xx).
-
-
From the Log file contains the following fields section, perform the following steps:
-
Add the request headers, response headers, and cookies that will be logged for each request from the Custom Request Headers, Custom Response Headers, and Custom Cookies options.
You may either select or type the name of the desired headers and/or cookies. Click on the list to add additional headers or cookies. Remove a header or cookie by clicking on its x.
Although other settings take effect quickly, it may take up to 90 minutes before data for custom request/response headers and cookies is logged.
- Click Expand All.
- Mark each field that will be reported for each request submitted to the CDN.
- Clear each field for which log data should not be reported.
Add or clear all of the fields associated with a category by marking or clearing the category's header.
-
To set up RTLD Rate Limiting
-
From the Filter by Edge CNAME section, perform one of the following steps:
-
Filter log data by one or more edge CNAME(s)
- Determine whether log data will be filtered to include or exclude requests to the selected edge CNAME(s) by selecting either Matches or Does Not Match, respectively.
-
Select one or more edge CNAMEs from the option directly to the right of the above option.
Filter the list by typing the entire or partial hostname. For example, typing co will filter the list to include all hostnames that contain co (e.g., cdn.example.com and corp.example.org).
-
Upload all log data regardless of edge CNAME
Verify that an edge CNAME has not been defined within this section.
-
-
From the Filter by Country section, perform one of the following steps:
-
Filter log data by one or more countries:
- Determine whether log data will be filtered to include or exclude requests to the selected countries by selecting either Matches or Does Not Match, respectively.
-
Select one or more countries from the option directly to the right of the above option.
Filter the list by typing the entire or partial country name. For example, typing un will filter the list to include all countries that contain un (e.g., United States and United Kingdom).
-
Upload all log data regardless of country of origin:
Verify that a country has not been defined within this section.
-
-
From the Filter by User Agent option, perform one of the following steps:
-
Filter log data by user agent
Type a RE2-compatible regular expressionThis type of value is interpreted as a regular expression that defines a pattern of characters. pattern that identifies the set of user agents by which log data will be filtered.
-
Upload all log data regardless of user agent
Set it to a blank value.
-
-
From the Filter by Client IP option, perform one of the following steps:
-
Filter log data by one or more IP addresses:
- Determine whether log data will be filtered to include or exclude requests to the selected IP addresses by selecting either Matches or Does Not Match, respectively.
- Type one or more IP addresses within the option directly to the right of the above option.
-
Upload all log data regardless of IP address:
Verify that an IP address has not been defined within this section.
-
-
From the Filter By Action Type option, perform one of the following steps:
-
Filter log data by one or more enforcement action(s):
- Determine whether log data will be filtered to include or exclude requests to the selected enforcement action(s) by selecting either Matches or Does Not Match, respectively.
-
Select or type the name for one or more enforcement action(s).
-
Upload all log data regardless of enforcement action:
Verify that an enforcement action has not been defined within this section.
-
-
From the Filter By Request Method option, perform one of the following steps:
-
Filter log data by one or more request method(s):
- Determine whether log data will be filtered to include or exclude requests to the selected request method(s) by selecting either Matches or Does Not Match, respectively.
- Select or type the name for one or more request method(s).
-
Upload all log data regardless of request method:
Verify that a request method has not been defined within this section.
-
-
From the Filter By Scope Name option, perform one of the following steps:
-
Filter log data by one or more security application manager(s):
- Determine whether log data will be filtered to include or exclude requests to the selected security application manager(s) by selecting either Matches or Does Not Match, respectively.
-
Select or type the name for one or more security application manager(s).
-
Upload all log data regardless of security application manager:
Verify that a security application manager(s) has not been defined within this section.
-
-
From the Filter By Action Limit ID option, perform one of the following steps:
-
Filter log data by one or more rate rule(s):
- Determine whether log data will be filtered to include or exclude requests to the selected rate rules(s) by selecting either Matches or Does Not Match, respectively.
-
Type the name for one or more rate rule(s).
-
Upload all log data regardless of rate rule:
Verify that a rate rule has not been defined within this section.
-
-
From the Filter By URL Regex option, perform one of the following steps:
-
Filter log data by URL
Type a RE2-compatible regular expressionThis type of value is interpreted as a regular expression that defines a pattern of characters. pattern that identifies the set of URLs by which log data will be filtered.
-
Upload all log data regardless of URL
Set it to a blank value.
-
-
From the Log file contains the following fields section, perform the following steps:
- Mark each field that will be reported for each request submitted to the CDN.
- Clear each field for which log data should not be reported.
To set up RTLD WAF
-
From the Filter by Edge CNAME section, perform one of the following steps:
-
Filter log data by one or more edge CNAME(s)
- Determine whether log data will be filtered to include or exclude requests to the selected edge CNAME(s) by selecting either Matches or Does Not Match, respectively.
-
Select one or more edge CNAMEs from the option directly to the right of the above option.
Filter the list by typing the entire or partial hostname. For example, typing co will filter the list to include all hostnames that contain co (e.g., cdn.example.com and corp.example.org).
-
Upload all log data regardless of edge CNAME
Verify that an edge CNAME has not been defined within this section.
-
-
From the Filter by Country section, perform one of the following steps:
-
Filter log data by one or more countries:
- Determine whether log data will be filtered to include or exclude requests to the selected countries by selecting either Matches or Does Not Match, respectively.
-
Select one or more countries from the option directly to the right of the above option.
Filter the list by typing the entire or partial country name. For example, typing un will filter the list to include all countries that contain un (e.g., United States and United Kingdom).
-
Upload all log data regardless of country of origin:
Verify that a country has not been defined within this section.
-
-
From the Filter by User Agent option, perform one of the following steps:
-
Filter log data by user agent
Type a RE2-compatible regular expressionThis type of value is interpreted as a regular expression that defines a pattern of characters. pattern that identifies the set of user agents by which log data will be filtered.
-
Upload all log data regardless of user agent
Set it to a blank value.
-
-
From the Filter By Security Application Manager option, perform one of the following steps:
-
Filter log data by one or more security application manager(s):
- Determine whether log data will be filtered to include or exclude requests to the selected security application manager(s) by selecting either Matches or Does Not Match, respectively.
-
Select or type the name for one or more security application manager(s).
-
Upload all log data regardless of security application manager:
Verify that a security application manager(s) has not been defined within this section.
-
-
From the Filter By Access Rule option, perform one of the following steps:
-
Filter log data by one or more access rule(s):
- Determine whether log data will be filtered to include or exclude requests to the selected access rule(s) by selecting either Matches or Does Not Match, respectively.
-
Select or type the name for one or more access rule(s).
-
Upload all log data regardless of access rule:
Verify that an access rule has not been defined within this section.
-
-
From the Filter By Custom Rule option, perform one of the following steps:
-
Filter log data by one or more custom rule(s):
- Determine whether log data will be filtered to include or exclude requests to the selected custom rule(s) by selecting either Matches or Does Not Match, respectively.
-
Select or type the name for one or more custom rule(s).
-
Upload all log data regardless of custom rule:
Verify that a custom rule has not been defined within this section.
-
-
From the Filter By Managed Rule option, perform one of the following steps:
-
Filter log data by one or more managed rule(s):
- Determine whether log data will be filtered to include or exclude requests to the selected managed rule(s) by selecting either Matches or Does Not Match, respectively.
-
Select or type the name for one or more managed rule(s).
-
Upload all log data regardless of managed rule:
Verify that a managed rule has not been defined within this section.
-
-
From the Log file contains the following fields section, perform the following steps:
- Mark each field that will be reported for each request submitted to the CDN.
- Clear each field for which log data should not be reported.
-
Set the Log Delivery Enabled option to the "on" position.
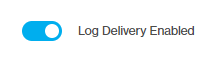
- Click Save.
To test connectivity
- From the Splunk Enterpise's home page, click Search & Reporting.
- Observe the What to Search section. Log data pushed from the CDN to Splunk Enterprise will be reported as events in this section.
More Information
-
RTLD may deliver log data to one or more of the following destinations:
-
Log fields vary by RTLD module.
Learn more: RTLD CDN | RTLD Rate Limiting
- Verifying Log Data
Edgecast CDN