Live Slicer Health Monitoring
Monitor the health for all recently active Live Slicers through the following tools:
-
API: View core status information via the following services:
- Integration API - /api2/slicer/status: Queries the backend to find out the last known status for one or more Live Slicers.
- Live Slicer API - /status: Queries a Live Slicer directly for current status information.
-
Dashboard: The Live Slicer Monitoring dashboard provides the following information at a glance:
- Current and recently active Live Slicers associated with the active Slicer View.
- Information and statistics on those Live Slicers.
View diagnosis and troubleshooting information.
Quick Start
Quickly set up Live Slicer health monitoring by performing the following steps:
- Enable monitoring on your account.
- Create a view for the desired Live Slicers.
- Monitor the Live Slicers identified above from the Live Slicer Monitoring dashboard.
Setup
Setting up Live Slicer health monitoring involves:
- Selecting one or more customer account(s) whose Live Slicers can be monitored.
- Creating a Slicer View that identifies the set of Live Slicers that will be monitored.
- Creating a rule set that defines the criteria when metrics will trigger and then clear an alert. Assign this rule set to the desired Live Slicer(s).
- Defining notification preferences.
- Granting Live Slicer monitoring access to other accounts.
Monitoring Prerequisites
The Live Slicer Monitoring dashboard shows health statistics for all active and recently active Live Slicers associated with a Slicer View. You may only add Live Slicers to a Slicer View when the following conditions are met:
-
You must be authorized to monitor the desired Live Slicer(s). Authorization is granted under any of the following conditions:
- The desired Live Slicer(s) correspond to your customer accountA customer account allows the management of Slicers, Live Slicers, live channels, live events, and content.The two types of customer accounts are account and user..
-
A userA user, which is a type of customer account, allows an individual user to manage their own Slicers / Live Slicers, live channels, live events, and content. If a user has been associated with an account, then that user may also leverage that account's shared configuration. that owns the desired Live Slicer(s) has granted you monitoring permissions on their customer account.
Monitoring permissions defined on the Account Access page only determine access to the legacy Live Slicer Health dashboard. This version of the Live Slicer Monitoring dashboard requires that you grant monitoring permissions through the Allowed Watchers page.
Learn more. -
You belong to an organizationAn organization, which is a system-defined entity that contains accounts and users, allows the use of shared rulesets for Live Slicer health monitoring. that has been assigned the accountAn account is a dedicated customer account that allows multiple users to leverage shared Live Slicers, live channels, live events, and content. that owns the desired Live Slicer(s).
- You must enable monitoring on the customer account that owns the Live Slicer.
Enabling/Disabling Monitoring
Before you can add a Live Slicer to a Slicer View, you must first enable monitoring on the customer account that owns it.
You may only enable monitoring on customer accounts to which you have been granted monitoring access.
To enable monitoring on an account
- Navigate to the Monitored Accounts page.
 How?
How? - Click Configure Monitored Accounts.
- Mark each customer account for which monitoring will be enabled.
- Click Add # Accounts.
To disable monitoring on an account
- Navigate to the Monitored Accounts page. How?
- Hover over the desired customer account and the click Delete Selected Accounts.
- Click Yes, Delete It to confirm that monitoring should be disabled on the account.
Disabling monitoring removes that customer account's Live Slicers from your Slicer Views.
Monitoring Permissions
You may allow other users to monitor your Live Slicers.
Users with either the admin or read/write permission may also determine the set of users that will be allowed to monitor the Live Slicers associated with each of your organization's accounts.
Learn more.
To allow user(s) to monitor your Live Slicers
- Navigate to the Allowed Watchers page. How?
-
Organization: Admin and Read/Write Users
Set the Accounts option to Personal.
-
From the right-hand pane, type the name of the user (e.g., joe@example.com) that will be allowed to monitor your Live Slicers.
Verify the specified user name before adding it. For your security, our system does not validate user names.
- Click + Add Watcher.
- Repeat steps 3 and 4 as needed.
To disallow user(s) from monitoring your Live Slicers
- Navigate to the Allowed Watchers page. How?
-
Organization: Admin and Read/Write Users
Set the Accounts option to Personal.
- Hover over the desired user and then click Delete Selected.
- Click Yes, Remove It to confirm that the user should no longer be allowed to monitor your Live Slicers.
Removing monitoring permissions from a user will remove your Live Slicers from the Slicer Views associated with that user.
To allow user(s) to monitor Live Slicers associated with an account
By default, all users associated with your organization will be allowed to monitor the Live Slicers associated with your organization's accounts.
Learn more.
This procedure may only be performed by users that have been granted either the admin or read/write permission.
- Navigate to the Allowed Watchers page. How?
- From the Accounts option, select the desired account.
-
From the right-hand pane, type the name of the user (e.g., joe@example.com) that will be allowed to monitor your Live Slicers.
Verify the specified user name before adding it. For your security, our system does not validate user names.
- Click + Add Watcher.
- Repeat steps 3 and 4 as needed.
To disallow user(s) from monitoring Live Slicers associated with an account
This procedure may only be performed by users that have been granted either the admin or read/write permission.
- Navigate to the Allowed Watchers page. How?
- From the Accounts option, select the desired account.
- Mark each desired user.
- Click Delete Selected.
- Click Yes, Remove It to confirm that the marked user(s) should no longer be allowed to monitor the Live Slicers associated with the account selected in step 2.
Removing monitoring permissions from a user will remove the account's Live Slicers from the Slicer Views associated with that user.
Slicer View
A Slicer View identifies a set of Live Slicers. You may switch between Slicer Views from the Live Slicer Monitoring dashboard. Use Slicer Views to:
- Focus on monitoring key Live Slicers.
- Quickly switch monitoring focus between different set of Live Slicers.
-
A user with either the admin or read/write permission can create Slicer Views that can be leveraged by any member of your organization. This type of Slicer View is known as an organization Slicer View.
To create a Slicer View
- Verify that you have enabled monitoring on the desired accounts.
- Navigate to the Slicer Views page. How?
-
Organization: Admin and Read/Write Users
Determine whether a Slicer View will be created for your organization or for personal use. From the Organizations option, select either your organization or Personal.
- Click + Create New Slicer View.
- From the View Name option, type the name that will be assigned to the Slicer View.
- Optional. Use the Search field to filter the list of available Live Slicers by name and owner
- Mark the desired Live Slicers.
- Click
 .
. - Click Save.
To modify a Slicer View
- Navigate to the Slicer Views page. How?
-
Organization: Admin and Read/Write Users
Determine whether to modify a Slicer View that was created for your organization or for personal use. From the Organizations option, select either your organization or Personal.
- Click on the desired Slicer View.
- Add Live Slicers by marking from the Available Slicers list and then clicking .
- Remove Live Slicers by marking them from the Slicers in View list and then clicking
 .
. - Click Save.
To delete a Slicer View
- Navigate to the Slicer Views page. How?
-
Organization: Admin and Read/Write Users
Determine whether to delete a Slicer View that was created for your organization or for personal use. From the Organizations option, select either your organization or Personal.
- Hover over the desired Slicer View and then click
 .
. - Click Yes, Delete It to confirm that the Slicer View should be deleted.
Monitoring Rules
Use rulesets to define rules that identify the set of metrics that will be monitored and the thresholds for warning/critical levels.
Key information:
- By default, Live Slicers will be monitored using a default set of read-only monitoring rules. However, a custom set of monitoring rules may be assigned to one or more Live Slicers.
- View your custom monitoring configurations from the Monitoring Rules page.
- Once you have created a custom monitoring configuration, you may reassign a Live Slicer to it. This means that the previous set of monitoring rules (e.g., Default) will no longer apply to the Live Slicer, since a Live Slicer may only be associated with a single set of monitoring rules at any given time.
- All metrics, with the exception of Closed Captioning Last Seen, are updated every 4 seconds. The Closed Captioning Last Seen metric is updated every 10 seconds.
- The Live Slicer will only report monitoring data when slicing content. It cannot report data when it is in another state (i.e., ad break, replace content, or blackout), since it is not receiving a video feed.
-
A user with either the admin or read/write permission can create rulesets that can be leveraged by any member of your organization. This type of ruleset is known as an organization ruleset.
To create a custom set of monitoring rules
- Navigate to the Monitoring Rules page. How?
-
Organization: Admin and Read/Write Users
Determine whether a ruleset will be created for your organization or for personal use. From the Organizations option, select either your organization or Personal.
- Click + Create New Ruleset.
- From the Ruleset Name option, type the name that will be assigned to it.
-
Configure each metric that should trigger warning/critical status.
- Find the desired metric.
- From the Severity option, select either Warning or Critical.
-
Define the conditions under which the metric will change health states. Metric configuration varies according to whether a metric toggles between two states or if it performs measurements.
-
States
- Configure the Set option to the number of seconds that the sub-optimal state (e.g., no signal, no closed captions detected, or black video was detected) must persist before the Live Slicer's health will change to the severity defined in the Severity option.
- Configure the Clear option to the number of seconds that the optimal state must persist before the Live Slicer's health will change back to healthy.
-
Measurements
- Configure the Set Threshold option to the condition that must be met for the number of seconds defined in the Set Duration option before the Live Slicer's health will change to the severity defined in the Severity option.
- Configure the Clear Threshold option to the condition that must be met for the number of seconds defined in the Clear Duration option before the Live Slicer's health will change back to healthy.
-
- Repeat the above steps as needed.
- Click Save.
To modify a custom set of monitoring rules
- Navigate to the Monitoring Rules page. How?
-
Organization: Admin and Read/Write Users
Determine whether to modify a ruleset that was created for your organization or for personal use. From the Organizations option, select either your organization or Personal.
- Click on the desired ruleset.
- Review and modify the conditions under which metrics will change health states as needed.
- Click Save.
To delete a custom set of monitoring rules
- Navigate to the Monitoring Rules page. How?
-
Organization: Admin and Read/Write Users
Determine whether to delete a ruleset that was created for your organization or for personal use. From the Organizations option, select either your organization or Personal.
- Mark each desired ruleset.
- Click Delete Selected Rulesets.
- Click Yes, Delete It.
To assign a custom set of monitoring rules to one or more Live Slicers
- Navigate to the Monitoring Rules page. How?
- Determine whether you will map a ruleset that was created for your organization or for personal use. From the Organizations option, select either your organization or Personal.
- Click Ruleset Mappings.
- From the 1. Choose a Ruleset to Apply option, select the desired custom monitoring configuration.
- Optional. Use the Search field to filter the list of available Live Slicers by name and owner
- Mark the desired Live Slicers.
- Click Apply Ruleset to Selected Slicers.
Alternatively, you may assign a ruleset to a Live Slicer from the Live Slicer Monitoring dashboard by clicking on the desired Live Slicer and then selecting the rule set that will be applied to it from the Ruleset option.
To assign the default set of monitoring rules to one or more Live Slicers
- Navigate to the Monitoring Rules page. How?
- Determine whether you will map a ruleset that was created for your organization or for personal use. From the Organizations option, select either your organization or Personal.
- Click Ruleset Mappings.
- Optional. Use the Search field to filter the list of available Live Slicers by name and owner
- Mark the desired Live Slicers.
- Click Remove Ruleset from Selected Slicers.
Monitoring Metrics
A description for each monitoring metric is provided below.
View diagnosis and troubleshooting information.
| Rule | Description |
|---|---|
|
Determines the length of time that may elapse since the end of the last ad break before triggering a warning/critical status. The Live Slicer resets this metric upon changing state (e.g., Slicing, Replacing Content, and Blackout). Troubleshooting Check whether ad breaks are being triggered. |
|
| Black Video |
Determines the length of time that black frames may be sent by a Live Slicer before triggering a warning/critical status. This rule measures the duration of black video by averaging the video's luminosity percentage over the last few seconds. Periods of black video may be normal. Consider the source content when setting critical/warning thresholds. Diagnosis Check the luma response parameter for a very low value. Troubleshooting Check the source feed to resolve issues with video input. |
| Closed Captions Last Seen |
Indicates the amount of time since the Live Slicer received closed captioning data. Key information:
Troubleshooting Check the source feed. |
| Dropped Frames |
Determines how many frames may be dropped within the current reporting period before triggering a warning/critical status. This metric requires Live Slicer version 16031400 or higher. |
| Extended Ad Break |
Determines the maximum duration of an ad break before triggering a warning/critical status. Troubleshooting Verify that automation scripts are sending valid ad break instructions to the Live Slicer. Also, verify that the Live Slicer is acting upon those instructions. |
| Last Update Time |
Indicates the amount of time since an update from the Live Slicer was received. A high value for this metric is indicative of one of the following conditions:
Troubleshooting Check for an egress bandwidth issue. |
| Loss of Audio |
Determines the length of time during which audio is not detected before triggering a warning/critical status. Periods of silence may be normal. Consider the source content when setting critical/warning thresholds. Diagnosis Check the vol response parameter for a very low value. Troubleshooting Check the source feed to resolve issues with audio levels. |
| Nielsen Tag Last Seen |
Determines the length of time that may elapse since the Live Slicer last received a Nielsen watermark before triggering a warning/critical status. Key information:
Troubleshooting Check whether Nielsen watermarks are being inserted into the audio stream fed to the Live Slicer. |
| Processing Backlog |
Determines how many packets may be queued to be read by the Live Slicer before triggering a warning/critical status. Key information:
Troubleshooting Check for insufficient resources. |
|
Determines the length of time that may elapse since the Live Slicer last received a SCTE 35/104 signal before triggering a warning/critical status. |
|
|
Determines whether a loss of the Live Slicer's signal will trigger warning or critical status. A loss of signal is also indicated in the Live Slicer's thumbnail preview by green/black frames or a predefined background image. |
|
| Static Audio |
Determines the length of time during which static audio is detected before triggering a warning/critical status. Static audio is detected by analyzing the audio's loudness percentage over the last few seconds. This rule ignores periods of silence. Diagnosis Check the vol response parameter for a static value. Troubleshooting Check the source feed to resolve issues with audio levels. |
| Static Video |
Determines the length of time during which static video (e.g., green screen, color bars, or a frozen frame) is detected before triggering a warning/critical status. Static video is detected by analyzing the video's average luminosity percentage over the last few seconds. Diagnosis Check the luma response parameter for a static value. Troubleshooting Check the source feed to resolve issues with video input. |
| Upload Queue |
Determines how many slices may be queued for upload before triggering a warning/critical status. Diagnosis A value higher than 2 may be indicative of Live Slicer connectivity issues. Troubleshooting Check for an egress bandwidth issue. |
Notifications
A Live Slicer may be configured to provide Live Slicer health information via:
Audio Notifications
The Live Slicer Monitoring dashboard may be configured to provide audio cues when one of the following conditions is true:
- The state of a Live Slicer changes from "Healthy" to "Warning."
- The state of a Live Slicer changes to "Critical."
Audio notifications will play on each device on which the Live Slicer Monitoring dashboard has been loaded, regardless of whether it is the active browser tab/window or if it has been minimized.
To set up audio notifications
- Navigate to the Notifications page. How?
- Click + Create New Profile.
- From the Name option, type the name of the new notification profile.
- Toggle warning or critical audio notifications by clicking on the Enabled/Disabled Audio Alarm option from the Warning or Critical section.
- Click Save.
- Navigate to the Live Slicer Monitoring dashboard. How?
- From the Saved Views option, select a Slicer View that contains the desired Live Slicer.
- Select the desired Live Slicer.
- From the Active Notification Profile option, select the notification profile created in step 5.
- Repeat steps 7 - 9 for each desired Live Slicer.
Getting to Know the Dashboard
The Live Slicer Monitoring dashboard provides statistics and graphs that describe Live Slicer health.
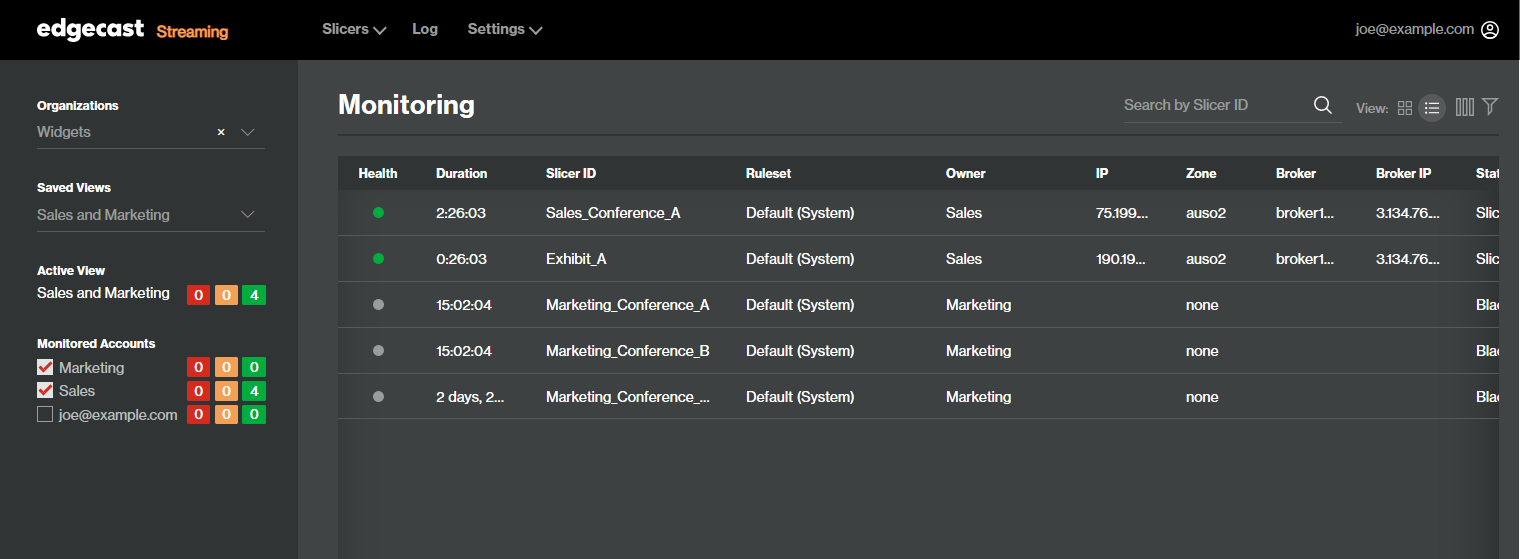
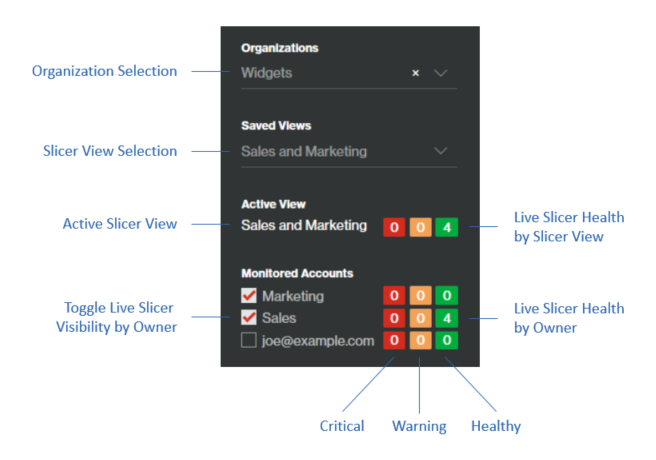
The left pane (shown below):
- Determines whether you will view the Slicer View(s) associated with your personal user account or your organization's shared ones.
- Allows you to switch to a different Slicer View.
- Indicates the current Slicer View and the number of Live Slicers associated with it by health status.
- Toggles Live Slicers from the dashboard by owner. For each owner, it also indicates the number of Live Slicers by health status.
The right pane provides the following information and statistics for each Live Slicer associated with the current Slicer View.
| Column Name | Description |
|---|---|
| Health |
Indicates Live Slicer health via the following color-coded icons:
A Live Slicer's status is determined by ruleset. If a Live Slicer has been assigned multiple rulesets, then each unique combination of Live Slicer and ruleset will be listed on the dashboard. |
| Duration |
Indicates the amount of time that the Live Slicer has been in the current health state. |
| Slicer ID |
Indicates a Live Slicer's ID. This ID is defined by the slicerID parameter in the Live Slicer's configuration file. |
| Ruleset |
Indicates the ruleset used to determine the state of Live Slicer health. |
| Owner |
Identifies the name of the user that owns the Live Slicer. |
| IP |
Indicates the Live Slicer's IP address. |
| Zone |
Indicates the zone to which the Live Slicer is pushing content. |
| Broker |
Identifies the name of the broker handling the Live Slicer's content. |
| Broker IP |
Indicates the IP address of the broker handling the Live Slicer's content. |
| State |
Indicates the Live Slicer's current state.
|
| Signal |
Indicates the input signal type.
|
| Luma |
Indicates the average luminosity percentage for the last few seconds of video. This percentage will only be returned when the Live Slicer has reported a luma value. |
| Vol |
Indicates the average loudness percentage for the last few seconds of audio. This percentage will only be returned when the Live Slicer has reported a volume value. |
| CCLS |
Indicates the number of seconds since the Live Slicer received the most recent caption. |
| NTLS |
Indicates the number of seconds since the Live Slicer received the most recent Nielsen tag. |
|
SCTELS |
Indicates the number of seconds since the Live Slicer received the most recent SCTE signal. |
| PB |
Indicates the number of packets that are queued to be read by the Live Slicer. |
| DF |
Indicates the number of dropped frames. |
| UQ |
Indicates the number of slices that are awaiting to be uploaded. |
| CPU |
Indicates the percentage of CPU usage for the computer hosting the Live Slicer. CPU usage is reported for 1 second, 5 seconds, and 15 seconds ago. |
| OS |
Indicates the operating system for the computer hosting the Live Slicer. |
| Real MEM |
Indicates the amount of physical memory, in MB, used by the Live Slicer. |
| Virt MEM |
Indicates the amount of virtual memory, in MB, used by the Live Slicer. |
Key information:
-
By default, all Live Slicers that have been associated with the currently selected Slicer View and that have been active within the last 24 hours are displayed on the dashboard. This list may be filtered by Live Slicer ID, health status, or account owner.

- Filter by Live Slicer ID by typing the desired ID and then pressing the Enter key.
- Filter by Live Slicer health status by clicking
 , marking and/or clearing the desired statuses, and then clicking off of it to hide the popup.
 - Choose the set of columns that will be displayed by clicking
 .
.
- Clicking on a Live Slicer provides more detailed information about that Live Slicer and its health. This detailed view is known as Live Slicer Details.
Live Slicer Details
View more detailed health information by clicking on a Live Slicer.
Key information:
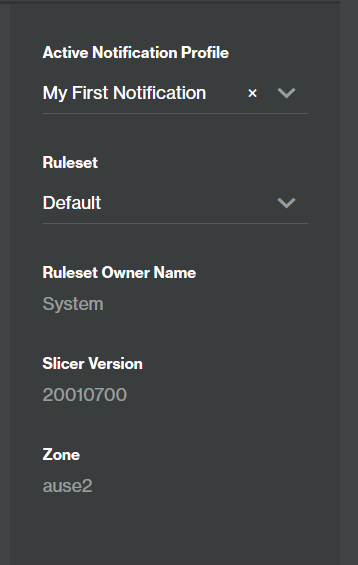
-
Live Slicer health is measured according to its current ruleset. View and/or set a Live Slicer's ruleset from the pane on the right-hand side of the window.

You may also assign rulesets to one or more Live Slicer(s) from the Monitoring Rules page.
- View and/or set the profile that determines when the Live Slicer will push health data to Amazon SNS or trigger audio notifications from the pane on the right-hand side of the window.
This mode consists of the following four views:
-
Slicer Snapshot
This view consists of the following sections:
-
Preview: Displays a thumbnail preview of the Live Slicer's output. The output for this preview varies according to its state.
- Slicing: Displays recently sliced content.
- Ad Break: Displays a message indicating that the thumbnail is unavailable.
- Replacing Content: Displays a message indicating that the thumbnail is unavailable.
- Blackout: Displays a message indicating that the thumbnail is unavailable.
- Offline: By default, green frames are shown whenever the signal is lost. Black frames or an image may be shown instead when either the no_signal_pad or the no_signal_image setting is defined.
- Health Level: Indicates the Live Slicer's current health status and the duration that it has been in that state.
- Slicer Status: Indicates the Live Slicer's status and the duration that it has been in that state.
-
Health - Ruleset: Displays historical health status for the current Live Slicer. The line graph's title indicates the ruleset through which health status was determined.
You may view Live Slicer health for a previous time window by clicking the Choose Start Date link that appears to the right of the Start Date option and then selecting the desired start date and time.
-
-
Charts
This view graphs historical statistics for key metrics. Click on a metric to view its line graph.
You may view metric health for a previous time window by clicking the Choose Start Date link that appears to the right of the Start Date option and then selecting the desired start date and time.
Each metric is color-coded to indicate health status.
-
 Healthy: Indicates that the metric is below warning thresholds.
-
 Neutral: Indicates that the metric is not being monitored for the purpose of determining the Live Slicer's health status.
 -
 Warning: Indicates that the metric is at a warning level.
-
 Critical: Indicates that the metric is at a critical level.
Some of the metrics reported in this view may be responsible for determining Live Slicer health status in multiple ways. This relationship is explored below.
Metric Description Signal Indicates the input signal type. Health status is determined by Signal Status.
Luminosity Indicates the average luminosity percentage for the last few seconds of video. This percentage will only be returned when the Live Slicer has reported a luma value. Health status is determined by Black Video and Static Video.
Volume Indicates the average loudness percentage for the last few seconds of audio. This percentage will only be returned when the Live Slicer has reported a volume value. Health status is determined by Loss of Audio and Static Audio.
Closed Captions Indicates either the number of seconds since the Live Slicer received the most recent caption or None if closed captions have never been received. Health status is determined by Closed Captions Last Seen.
Nielsen Tag last seen Indicates the number of seconds since the Live Slicer received the most recent Nielsen tag. Health status is determined by Nielsen Tag Last Seen.
SCTE last seen
Indicates the number of seconds since the Live Slicer received the most recent SCTE signal. Health status is determined by SCTE Last Seen.
Processing backlog Indicates the number of packets that are queued to be read by the Live Slicer. Health status is determined by Processing Backlog.
Dropped Frames Indicates the number of dropped frames. Health status is determined by Dropped Frames.
Upload Queue Indicates the number of slices that are awaiting to be uploaded. Health status is determined by Upload Queue.
Extended Ad Break Indicates duration of the current ad break in seconds. Health status is determined by Extended Ad Break.
A Live Slicer's status is determined by ruleset. If a Live Slicer has been assigned multiple rulesets, then each unique combination of Live Slicer and ruleset will be listed on the dashboard.
-
-
Health Details
This view provides detailed Live Slicer health for a given timestamp.
- Details: Identifies the timestamp for the current set of health data and the amount of time that the Live Slicer has been in the current state.
- Metrics: Provides health data for each metric. Specifically, each row identifies a metric, its health status at the time identified in the Details section, and a brief description for the last time that this metric's health status changed.
-
Status
This view provides metric data for a given timestamp.
- Details: Identifies the timestamp for the current set of health data.
- Status JSON: Provides detailed Live Slicer information, including metrics, in JSON format.
- Metrics: Provides data for each metric.
Alert Log Data
The Alert Log page displays log data for alerts generated for the current Live Slicer over the specified date range. Leverage this historical data to discover trending issues and to adjust warning/critical alert levels.
Alert log data is paginated and limited to 10,000 entries. If you encounter this limitation, adjust your filters (e.g., reduce the time window or only show changes in health status) to reduce the number of entries.
Alert log data is displayed in reverse chronological order (i.e., newest to oldest event).
Log alerts are triggered according to the ruleset(s) assigned to your Live Slicer(s).
Key information:
-
Filter log data by:
- Health Status: Mark or clear the desired health status(es).
- Status Change: Filter log data to only show changes in a Live Slicer's health status by marking the Show changes in health only option.
- Time: Specify the date range for which log data will be shown by setting the From and To options and then clicking Apply.
-
The following information is provided for each logged alert:
Column Name Description Slicer ID
Indicates a Live Slicer's ID. This ID is defined by the slicerID parameter in the Live Slicer's configuration file.
Account
Identifies the name of the user that owns the Live Slicer.
Previous
Indicates the Live Slicer's health status immediately prior to the point-in-time identified by the Timestamp column.
Current
Indicates the Live Slicer's health status at the point-in-time identified by the Timestamp column.
Created Date
Indicates the relative time that has elapsed since the log event took place.
Timestamp
Indicates the date and time (UTC) at which the log event took place.
Problem Metrics
Indicates zero or more metrics that caused a warning or critical health status.
Common tasks:
- Viewing Log Data: View the Alert Log page by clicking Log from the Live Slicer Monitoring dashboard.
- Refreshing Log Data: View log events that have occurred since the start of your browsing session by clicking Apply.
- Filtering Log Data: Filtering options are provided on the left-hand side of the page.
-
Navigating Log Data: The Alert Log page can display up to 15 alert events. View older alerts by clicking on one of the following:
- « First: Navigates to the first page.
- Previous: Navigates to the previous page.
- Page_Number: Navigates to a specific page.
- Next: Navigates to the next page.
- Last »: Navigates to the last page.
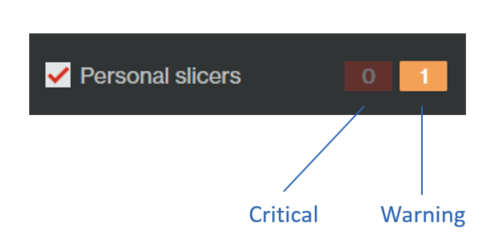
Penalty Box
The Penalty Box allows you to quickly review all Live Slicers that are experiencing one or more monitored metrics at warning levels, critical levels, or both.
Key information:
-
View the Penalty Box by performing the following steps:
- From the main menu, navigate to Services and then click on Monitoring 2.0.
- Open the Slicers menu and then click on Penalty Box.
- The Penalty Box displays all unhealthy Live Slicers for any of your monitored accounts.
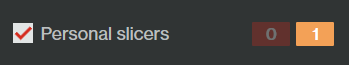
-
Unhealthy Live Slicers for your own account belong to the Personal slicers category. This category also includes any Live Slicers to which you have been granted access that do not belong to your organization.
- If you belong to an organization, then your organization will also be displayed as a category.
-
Each category indicates the number of Live Slicers that are experiencing one or more monitored metrics at critical and warning levels.
- Use the Unhealthy Only option to determine whether to list your organization or Personal slicers when that category only contains healthy Live Slicers.
Issue Identification and Remediation
Learn how to interpret status information.
It is not recommended to use log data as a monitoring mechanism.
Leverage log data to identify an issue and troubleshoot it. Issues are typically due to:
- Egress bandwidth
- Source signal
- System resources
- Configuration
Egress Bandwidth
Most Live Slicer issues are due to egress bandwidth.
A Live Slicer combats latency issues by uploading up to five video slices in parallel. Under ideal circumstances, it will only upload one or two slices at a time. However, bandwidth constraints may require it to upload additional slices in an effort to catch up. If bandwidth continues to fall short of what is needed, the slicer will buffer up to 5 minutes of video before it begins dropping incoming frames.
Confirming Egress Bandwidth Issues
Confirm egress bandwidth issues through the following error messages:
| Error Message | Description |
|---|---|
|
Error uploading slice X, will retry Unable to upload slice X, HTTP error X Failure uploading slice, will retry |
These error messages are indicative of an egress bandwidth issue under the following circumstances:
More Information:
|
|
Upload queue depth: X |
Check for messages containing a value higher than 2 or 3. More Information:
|
|
Switching to alternate upload site |
Check for frequent occurrences of this error message. More Information:
|
|
Failed to send status to broker: <message> |
This message indicates that the Live Slicer is unable to communicate with the backend. More Information: The Live Slicer will retry until it is able to resume communication. |
|
Clearing current broker - too many consecutive communication failures |
This message indicates that the Live Slicer was unable to communicate with the backend. More Information: The Live Slicer will switch to a different backend component and then retry. |
|
Unable to mark slice X delivered, <reason> |
Check for frequent occurrences of this error message. More Information:
|
Testing
This tool only tests burst bandwidth. It is not a good indicator of average bandwidth.
The Live Slicer includes a tool that reports the bandwidth, in Megabits per second, between the Live Slicer and the backend. Use this tool to assess whether a Live Slicer is experiencing network connectivity issues with the backend.
Usage:
Run the following command:
Source Signal
A Live Slicer that is not receiving a video signal will output blank green frames with silent audio. This state is indicated by the status methods when the signal response parameter returns "No signal."
Diagnosis
A source signal issue may arise due to the SDI source or the UDP transport stream.
SDI Source
The following message indicates that the Live Slicer is unable to receive the source signal from the capture card:
| Error Message | Description |
|---|---|
|
Card thinks signal dropped |
The Live Slicer will log this message up to 5 consecutive frames before it begins outputting green frames. |
UDP Transport Streams
Under normal circumstances, a UDP transport stream may drop packets in transit to the Live Slicer and generate any of the error messages listed below. Identify signal issues by the frequency of these error messages.
| Error Message | Description |
|---|---|
|
injecting Xms of blank video |
Indicates that blank green frames were inserted as a result of video decoding inactivity. This action will only be taken after a full second of missing video. |
|
injecting Xms of blank audio |
Indicates that silent audio was inserted as a result of audio decoding inactivity. This action will only be taken after a full second of missing audio. |
|
tossing frame until we have audio to match tossing frame until timestamps synchronize |
Indicates that the Live Slicer has started receiving data again after signal loss, but it is unable to synchronize the audio/video data. It will continue to retry as it receives new audio/video data. |
|
Guesstimating frame timestamp ... |
Indicates that the Live Slicer has estimated the timing information relative to previous frames due to an in-stream timing information change. More Information:
|
|
Invalid pts delta ... |
Indicates that the Live Slicer is attempting to resynchronize audio/video after encountering a large discrepancy between the current and previous frame. |
|
frame older than recent estimation |
Indicates that the Live Slicer dropped a frame that was older than the previous frame and then attempted to resynchronize the audio/video. |
|
Unable to decode frame, skipping |
Indicates that the Live Slicer was unable to decode a video frame. More Information: This issue is commonly caused by dropped packets. This will prevent the frame from containing sufficient information for the purpose of decoding it. |
|
Unable to decode audio, skipping |
Indicates that the Live Slicer was unable to decode an audio frame. More Information: This issue is commonly caused by dropped packets. This will prevent the frame from containing sufficient information for the purpose of decoding it. |
Reverse Path Filtering
Tools that communicate directly with the network interface (e.g., Wireshark) will be unaffected by this issue. However, the Live Slicer will be unable to receive the signal.
A common obstacle with multicast UDP signals is reverse path filtering. This issue occurs when multicast packets arrive on an interface that doesn't have a route for the source address. By default, the Linux kernel will filter these packets and prevent them from being delivered to the Live Slicer.
Resolution/Remediation
Resolve this issue by either:
- Fixing the routing configuration.
-
Disabling reverse path filtering through the following command:
$ echo 1 > /proc/sys/net/ipv4/conf/all/rp_filter$ sysctl -w "net.ipv4.conf.all.rp_filter=0"
System Resources
The Live Slicer requires significant memory and CPU resources to perform real-time video processing. Insufficient resources may cause dropped frames.
Diagnosis
Check for dropped frames occurring without egress bandwidth symptoms. Upon detecting this condition, leverage system tools to monitor system resources (e.g., CPU usage, load average, and memory consumption).
| System Resource | Description |
|---|---|
|
Load Average |
Check load average by using a system tool, such as:
Verify that the load average is less than 2x the number of core processors. More Information:
|
|
Memory Usage |
Check memory usage by using a system tool, such as:
Check for high levels of swap usage by looking at the SwapTotal field in /proc/meminfo. This is an indicator of a performance issue that may cause dropped frames. More Information:
|
Configuration
This section covers common configuration issues that may prevent the Live Slicer from functioning properly.
| Issue | Description |
|---|---|
|
Closed captions not working with SDI feeds |
Perform the following steps:
More Information: The Live Slicer must be told where to look for CEA-608/708 closed captions for SDI feeds. By default, the slicer looks on ancillary line 9/13 for SMPTE 291M messages with the DID/SDID 0x61/0x01, which is the most common configuration for broadcast signals. |
|
Auto expiring assets |
Change the autoexpire_age setting in the Live Slicer's config file to the desired length of time and then restart the Live Slicer. More Information: By default, the Live Slicer expires live assets after 24 hours. |
|
Audio channel layout |
SDI Signal Only Update the Live Slicer's configuration file through the following steps:
More Information: By default, the slicer will use the first two channels from the input signal as a stereo pair. |
|
Unique Live Slicer IDs |
The following log message indicates that multiple Live Slicers are using the same ID: Unable to mark slice X delivered: Deliver rejected: slicing for beam Y is already done.
Resolve this issue by assigning a unique ID to each Live Slicer. More Information: A unique ID must be assigned to each Live Slicer regardless of whether it is capturing the same signal as other Live Slicers. |
Miscellaneous Troubleshooting Information
Asset Rollover
The maximum duration of a live asset is 8 hours. Once a live asset reaches this duration, the Live Slicer will start writing to a new asset.
Delayed Playback
Expired or deleted assets cannot be viewed on delay.
A live stream may either be played back in real-time or on delay. Delayed playback is useful when troubleshooting issues that occurred in the past.
View a live stream on delay by adding delay=<seconds> to the channel URL query parameters.
Organizations
An organization, which is a system-defined entity that contains accounts and users, allows the use of shared Slicer Views and rulesets for Live Slicer health monitoring. Both accounts and users are types of customer accounts. A customer account allows the management of Slicers, Live Slicers, live channels, live events, and content.
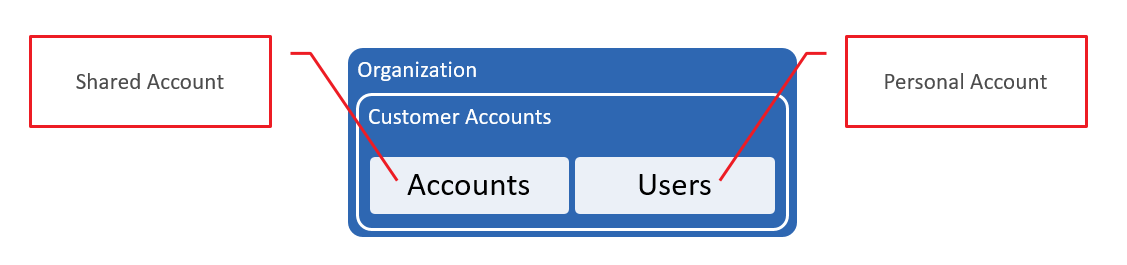
In this example, there is an organization called Widgets that contains the following customer accounts:
| Type | Name |
|---|---|
|
Accounts |
|
|
Users |
|
This organization contains Marketing and Sales accounts through which authorized users manage the Live Slicers for their Marketing and Sales conferences.
Key information:
- An account, which is a dedicated customer account, allows multiple users to leverage shared Live Slicers, live channels, live events, and content. Users may not log in directly to an account.
- A user allows an individual user to manage their own Slicers, Live Slicers, live channels, live events, and content. Authorized users may also monitor Live Slicers associated with accounts.
-
An administrator of your organization can modify an organization's user membership. All other organization properties are read-only.
An administrator may only add users that have previously used this version of the Live Slicer Monitoring dashboard.
-
All users associated with your organization will be able to:
-
Leverage your organization's Slicer Views and rulesets for Live Slicer health monitoring.
Users that have been granted either the admin or read/write permission are authorized to create, modify, and delete your organization's Slicer Views and rulesets.
-
Monitor the Live Slicers associated with your organization's accounts. A user may either leverage your organization's Slicer View(s) or create one or more Slicer View(s) for their own personal use.
Key information:
- All of your organization's users may select your organization's accounts from the Monitored Accounts page.
- Organization membership does not grant you access to the Live Slicers associated with the personal accounts of other members. However, another member may grant you permission to monitor their Live Slicers.
- By default, all users associated with your organization are authorized to monitor the Live Slicers associated with your organization's accounts. However, an administrator of your organization may modify each account's allowed watchers for the purpose of authorizing users outside of your organization or disallowing some of your organization's users from monitoring those Live Slicers.
-
- Our system is responsible for creating and associating accounts with an organization. An account may only be associated with a single organization.
- Contact your account manager to request an organization.
To modify an organization's membership and user roles
This procedure may only be performed by an administrator of your organization.
- Navigate to the Organizations Administration page. How?
- Click on your organization.
- Click on the Users tab.
-
Optional. Add users to your organization.
You may only add users that have previously used this version of the Live Slicer Monitoring dashboard.
- Click + Add Users.
-
In the 1. User(s): option, type the name of the user that will be added. If you would like to add multiple users, then delimit each user name with a comma.
Example:
joe@example.com,jane@example.com - From the 2. Select Role to Apply to user(s): option, select the level of access for the user(s) defined in the previous step.
- Click Add.
- Optional. Assign a new role to a user by clicking the user's role and then selecting the role that will be assigned to the user.
-
Optional. Remove users from your organization.
- Mark each desired user.
- Click Remove.
- Click Yes, Delete It.
- Click Save.